A lone, long candle may have a solemn significance in 2 places – a Church and a Trading Room!
To a trader a lone, long candle on the chart signals an instinctive urge to look for a calm before the storm. Namely a pullback, which strangely implies further highs ie. an impending Bullish Flag Pattern.
Flag patterns follow an on-going trend. How can a retail trader identify it?
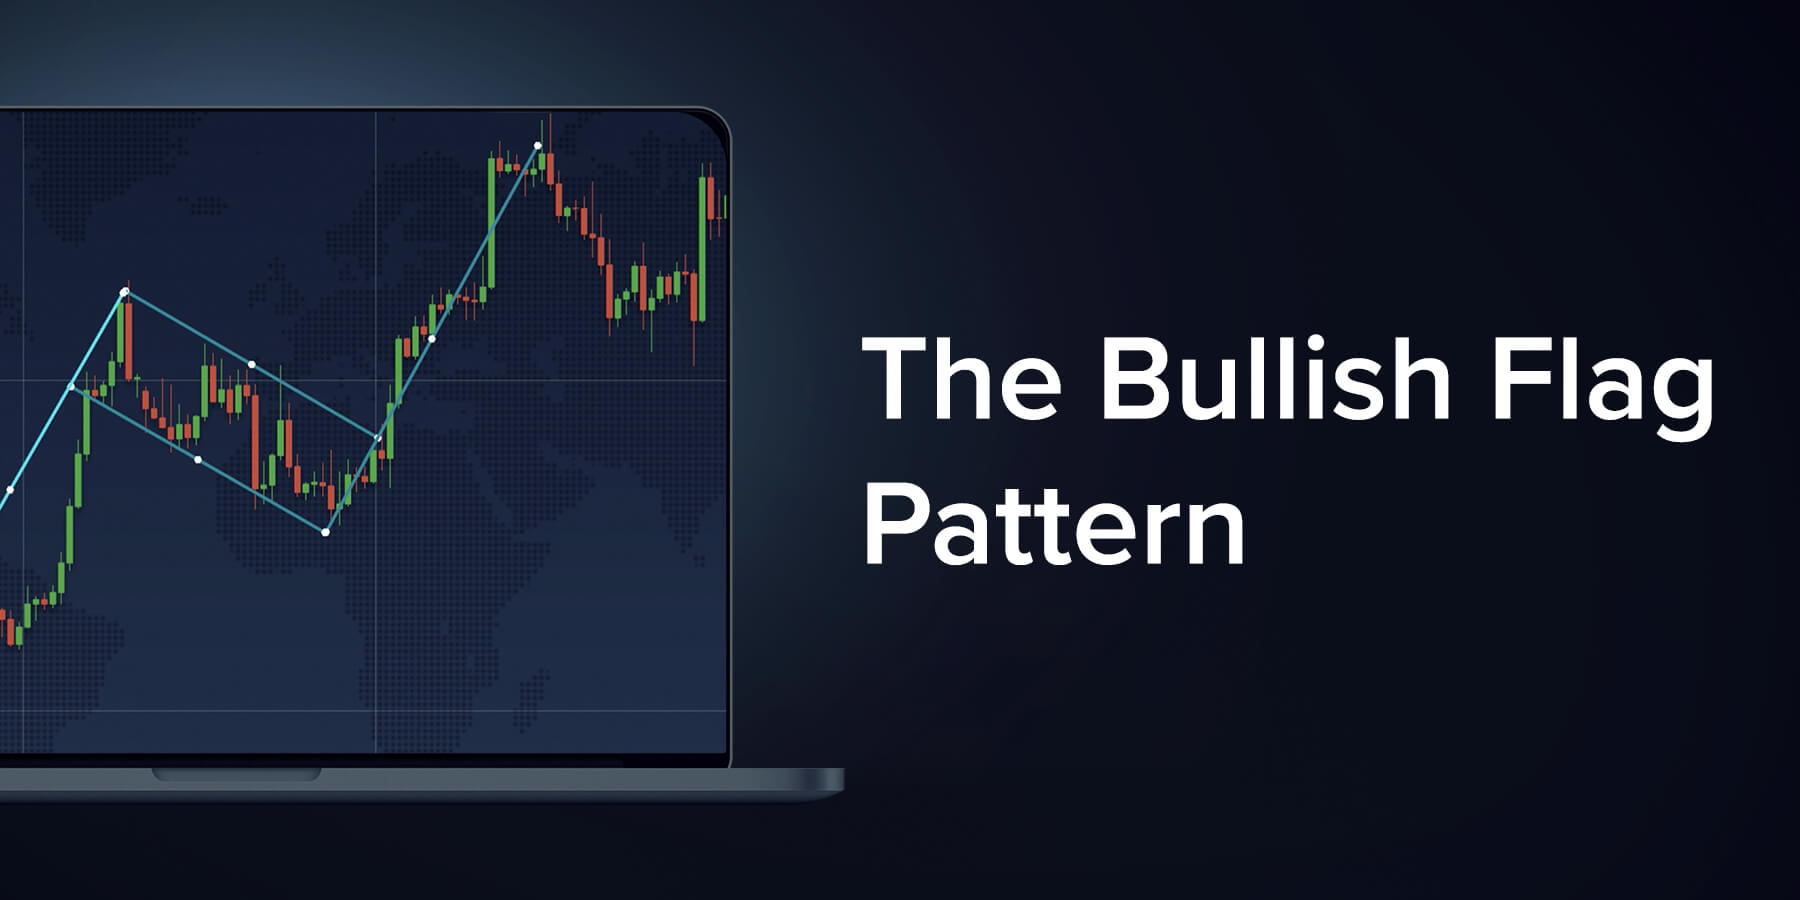
Flag pattern charts anatomically consist of 3 sub-parts:-
- One or more long candles, each signifying a day of vertical price movement of strong nature, viewed similar to a supportive flagpole
- Next, a few weeks of densely packed, correction phase candles, within a narrow range, which appear to be a pullback after the vertical move, strangely like a flag pattern, flying on the above pole
- Finally, the continued move in the original direction of trend, which is the breakout, the trader waits for.
When can one look for the flag pattern? When the market is overall, trending strongly, upward or downward. Further proof can be discerned when market sees brisk volumes in during flagpole and breakout (a and c) zones while there are very few players during correction phase (b).
Fundamentally, the flag pattern can be considered to build a ‘launching pad’ after buyers and sellers consolidate their positions and book their profits/losses ending the pullback. It is at this point that, fresh positions are taken (Going long in case a Bullish Flag Pattern is witnessed and going short in case of a Bearish Flag Pattern), once the pullback appears to go off steam.
The Bullish Flag Pattern has an upward flagpole, a rectangular lower sloping flag pattern between two trendlines (Support line below and Resistance line above), followed by the emergence of the bulls in the continuation trend.
The Bearish Flag Pattern on the other hand, shows a price movement sharply downward in short time, a rectangular upper flag shaped correction between two trendlines, and then continuation as a downtrend.
What are the benefits of trading on Flag Patterns?
- It is a useful short-term opportunity for the Intraday, Day as well as the Swing trader, given the time-span of progression and frequency of pattern
- The trader enters the trade in a clearly trending market, after time tested signals are perceived and hence considered predictable and trustworthy
- In anticipation of the continuance of the general trend, traders can place buy/sell orders, above the resistance/below the support anticipating a breakout, so as to be an early bird.
- Research has proven that the Flag Pattern is discernable in the case of many asset markets including forex, equities, commodities F&O as well.
- Thus, the trader can enter and exit the security at preconstructed levels in a planned manner.
It goes without saying that any trade, whatsoever the risk profile requires setting up of a pre-defined Take profit or a Stop-loss level, especially for the retail investor. In general terms, retracement during the correction phase should not be more than 35 to 38% of the flagpole phase. This having been established, stop loss level should be placed just below the support in the bull flag movement and take profit should be commensurate with the upward movement. Compared to a lot of shapes and patterns, the Flag Pattern has emerged as a safe bet, but having said that, identification of the flag pattern is the key for a trader and the eye for this detail comes with trade experience alone.


