

A transportation report can show hundreds of vehicle movements, kilometers traveled, and completed trips while failing to address the most important issue:
“Why did attendees wait 25 minutes for a shuttle after the event ended?”
For event planners and transportation consultants, the challenge is more than just gathering event transportation data. It is calculating which numbers reveal operational flaws, influence attendees’ experience, and help justify decisions to clients. The difference between reporting activity and measuring performance affects whether your next event goes better than the last.
Are Your Metrics Measuring Activity & Outcomes
Consider a shuttle service that completes all scheduled trips but regularly leaves passengers waiting at a crowded pickup location. On paper, the fleet might look productive, but in honest terms, the service is failing. This is where event transport monitoring requires a unique approach.
To cope with this, evaluate completed trips and consider whether they met actual passenger demand. Compare your planned service frequency to wait times, missed connections, and demand surges. These relationships reveal whether the transportation plan benefited people as well as vehicles.
An effective event transportation management strategy combines operational activity with measurable outcomes, giving transport consultants ways to improve service rather than simply reporting what happened.
Four Questions Your Transportation Data Should Answer
Here are the 4 most important questions that your data should answer first in reporting.
1. Where are attendees losing time?
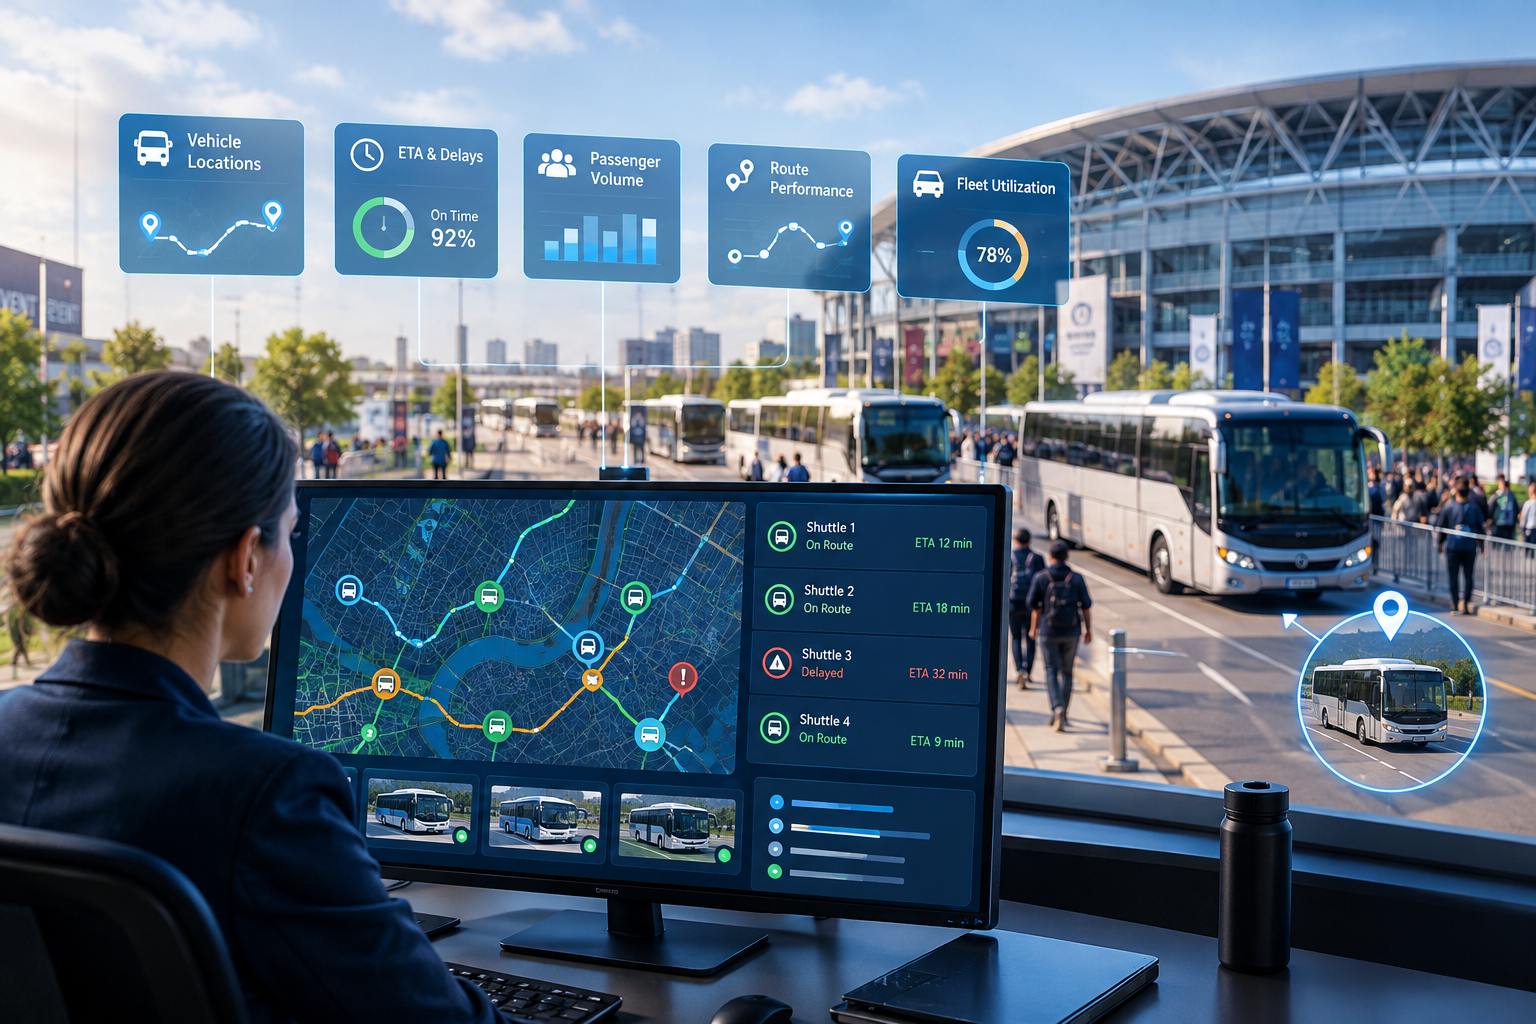
Use real-time shuttle tracking and event shuttle ETA monitoring to know where delays occur and how long passengers must wait. A delayed vehicle is one issue, but multiple delays at the same point indicate a scheduling or route-planning issue.
2. Are resources allocated according to demand?
Passenger counting for events allows you to compare passenger volumes across pickup points and time periods. Combining this data with event fleet GPS tracking can help to identify errors between vehicle availability and passenger demand.
3. Which decisions need faster attention?
A useful event transportation dashboard should show exceptions that require immediate action. This could include a missed departure, an unexpected route change, or a growing service gap.
4. What should change at the next event?
Use fleet utilization analysis to find how effectively vehicles were deployed. Examine delays, peak demand periods, and underused resources to identify areas for improved scheduling and allocation.
Turn Disconnected Numbers Into Operational Evidence
The true value of EventFalcon’sevent mobility intelligence platform is in connecting information that would otherwise be isolated in separate reports. GPS-IoT telematics for events, passenger movement records, and schedule data can provide a more complete picture of how the transportation network operates.
An event transport command centre helps teams use the information during live operations, while event mobility analytics can support post-event evaluations. Together, these capabilities allow planners to investigate not only what went wrong, but also why it happened and whether a corrective decision was effective.
Build Reports Around Better Questions
Before your next event, go through every metric in your transportation report. Discuss whether it supports a decision, identifies a risk, or helps in the measurement of an outcome. If a number does not meet any of these criteria, it might not be a priority in your reporting.
The goal is not to collect additional data. It aims at understanding the relationship between transportation resources, passenger experience, and operational performance. When event planners track the right metrics, transportation reports become more than just records of past activity. Rather, they are useful tools for designing better-run events.