Data has emerged as the stimulant for change in the modern technology-driven world. But, is it enough to generate colossal amounts of data? The real power of data lies in an organization’s capacity to analyze it. Also, it takes considerable skills and training to tap the potential of data to generate meaningful insights for the betterment of the business. Hence, building the data skills of an organization is of utmost importance. But, creating a robust data culture and nurturing data proficiency across all levels of a business are no piece of cake. However, the various Tableau eLearning paths can help you in this journey through different free, online curricula aimed at boosting an organization’s data skills.
Why is Tableau a Leader in Data Visualization Tools?
One of the most crucial tasks of any business is to recognize factors that impact customer behavior and the areas that need improvement. Hence, organizations need to be quick and spontaneous in identifying new business opportunities and act on data accordingly.
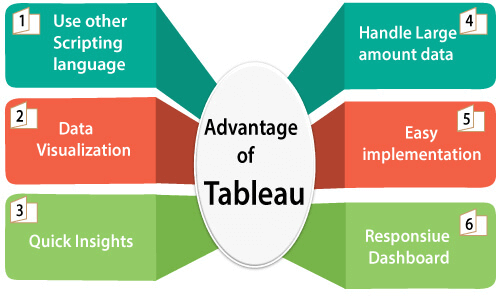
Tableau is much more than a mere data visualization tool. It offers new avenues to access, analyze, and understand data to discover business insights. Tableau also allows users to interact with data by leveraging visual analytics, thereby helping businesses make critical decisions through quick data analysis.
The fact that Tableau is a leader in its field is evident from the big names, such as Audi, Pfizer, Burger King, Amazon, and Bank of America that are using it. Tableau’s platform conglomerates augmented analytics features and the best visual practices with peerless research and development and customer-centric innovation. Moreover, the licensing model of Tableau ensures the right capability for customers at a reasonable price. Overall, Tableau is what is extensively helping organizations transform their data culture faster than ever.
Top 10 Tableau Interview Questions
Tableau eLearning is a web-based training that you can complete at your own pace. Regardless of your skill level, the Tableau eLearning course will help you in your Tableau learning journey through an interactive and curated course curriculum. However, a Tableau certification is just the first step. Once you’ve mastered Tableau skills through the Tableau eLearning certification, your next goal should be preparing for job roles that demand Tableau expertise.
So, take a look at these top, most frequently asked questions that you are likely to encounter in any Tableau interview!
1. What is Tableau?
Tableau is fast and powerful data visualization software that finds use in the business intelligence industry. With Tableau, it becomes easier to simplify raw data into an easily understandable format. Data visualizations are presented through dashboards in the form of diagrammatic representations.
2. How does Tableau work?
Tableau primarily evaluates databases and involves three easy steps:
- Connect Tableau to the database you want to analyze.
- Once you place the information on Tableau worksheets, you can analyze the data through filtering, sorting, calculations and so forth.
- The last step is to share the data analysis outcomes with other Tableau users through apps, PDF prints or the Tableau server.
3. What are the different Tableau file extensions?
The various Tableau file extensions include:
- Tableau Data Extract (.tde)
- Tableau Workbook (.twb)
- Tableau Datasource (.tds)
- Tableau Bookmark (.tbm)
- Tableau Packaged Datasource (.tdsx)
- Tableau Packaged Workbook (.twbx)
- Tableau Map Source (.tms)
- Tableau Preferences (.tps)
4. What are some of the popular attributes of Tableau?
Popular features of Tableau include:
- Data blending and real-time analysis
- Translation of queries to visualizations
- Data collaboration as well as data notifications
- Data viewing through Tableau reader
- The ability to import data of all sizes and ranges
5. What is a heat map?
A heat map is a color-coded graphical representation of data that indicates different data values through a color-coding technique. A higher value of a mark heats it, with a simultaneous darkening of color on the map.
6. What is the main difference between data joining and data blending in Tableau?
Data joining refers to merging data from a single source. On the other hand, data blending involves combining data from two entirely defined data sources.
What is the primary difference between an embedded data source and a published data source in Tableau?
A published data source allows the building of multiple workbooks connected to one single data source. The data in connected workbooks gets automatically updated by simply refreshing the data source. In contrast, every embedded data source has a distinct link to data, with the data’s scope being limited to the workbook in which the data source is embedded.
8. What is a treemap?
A tree map is a data visualization technique in Tableau that organizes data as a hierarchy of nested rectangles. The colors and sizes of rectangles correspond to the data values they project. Conventionally, parent rectangles are found tiled with their child elements.
9. What is a Tableau dashboard?
A Tableau dashboard is a set of different viewing tools that gives you a simultaneous view of various data types for comparison. Since dashboards are connected with datasheets, any modification to the data directly reflects in the dashboards.
10. What are the connection types in Tableau?
Tableau has the following two connection types:
- Live: It establishes a direct connection to the data source for direct fetching of data from tables. While data remains consistent and up-to-date, the access speed gets affected.
- Extract: It is a data snapshot put into the Tableau repository after extraction from the data source. Options are available for full, incremental, and periodic refreshing of the snapshot by scheduling in the Tableau server.
Any organization that wants to stay ahead in the competitive market must fruitfully harness data to derive critical business insights. As data volume continues to grow, organizations look for tools that can merge complex and diverse information. In such a scenario, Tableau comes in really handy for interpreting data in an easily understandable manner. Hence, having the right Tableau skills can prove to be of much value to your resume. So, go ahead and sign up for Tableau eLearning that suits you.


